Google Analytics 4 (GA4) first became available in October 2020, leading to a new way for companies to view app traffic and user engagement. While GA4 has been available for about three years, the sunsetting of Universal Analytics in June means it’s now Google’s default tracking technology.
So what does this mean for marketing metrics? With almost 40% of industry professionals concerned about reporting and data access, knowing how this shift impacts information gathering is extremely important.
Website traffic was a huge focus for Universal Analytics, and the available details within the software reflected that. Knowing how many visitors come to your site is still important, but this new generation of web analytics allows marketers to gain more comprehensive information into user interaction and behavior.
Many updates were implemented to make analytics better prepared for today’s marketing landscape, with the crowning jewel of GA4 being a new metric called engagement rate — the percentage of engaged sessions on your website. This giant leap for marketers sets a standard way to measure engagement rather than juggling insights like bounce rate and site clicks.
Let’s look at GA4’s latest innovation and discover how it can paint a clearer picture of your target audience through their interactions with your site.
How GA4 Calculates User Sessions
A session is recorded every time someone visits your site, and it’s what GA4 data pulls information from. Every pageview, click, transaction or other action is recorded during this period.
Universal Analytics tracked sessions, but GA4 does so differently. In GA4, a session starts the second a user first lands on your site with no currently active session. By default, a session timeout occurs after 30 minutes of user inactivity, but there’s no limit to how long a session lasts. Just note, you can adjust session timeout if you’d like more personalized metrics.
Previously, a session was terminated when one of the following had taken place:
- There was inactivity for 30 minutes.
- The session’s campaign parameters had changed.
- The time zone used to configure the Universal Analytics view indicated a new day had started.
While the way sessions are determined doesn’t change much, you may notice there are fewer total sessions in GA4 than there were in Universal Analytics.
What Counts as an Engaged Session?
If a session starts every single time someone clicks on your website, what exactly computes as a positive or productive site visit?
Google’s updated analytics tool desired to make a more accurate way to capture session engagement. To accomplish this, they introduced engaged sessions, which occur any time a person visits your site and spends 10 or more seconds on it, views two or more internal pages or has a conversion event.
Just one of these incidents has to occur to be considered an engaged session, which benefits the overall knowledge of your audience and what they want from your website.
The Importance of Measuring Engagement in GA4
Marketing is more congested than ever before, meaning the more information you can use to get a leg up on the competition, the better. Knowing your audience is essential to creating a customized user experience, which is more critical than you may think. In fact, McKinsey & Company found that 71% of consumers expect companies to deliver personalized interactions, and 76% get frustrated when this isn’t delivered.
Without insight into people’s interactions on your website, it’s hard to know what resonates with those you’re attempting to reach. GA4 gleans deeper and more expansive intelligence about each session — from exciting conversion events to the most minute details.
What Happened to Bounce Rate?
Before, when a user spent a short amount of time on a page and then left, it was called a bounce. This traditional view of engagement left much to be desired because it didn’t count this short site visit as engagement. GA4 replaces the bounce rate metric with engagement rate so marketing professionals receive a more nuanced perspective of each and every visitor’s action.
Subscribe to
The Content Marketer
Get weekly insights, advice and opinions about all things digital marketing.
Thanks for subscribing! Keep an eye out for a Welcome email from us shortly. If you don’t see it come through, check your spam folder and mark the email as “not spam.”
Other Critical Engagement Metrics in GA4
Engaged sessions are a super beneficial metric to track customer experience and interactions, but it’s not the only benchmark to monitor. Here are a handful of advantageous numbers to track in GA4:
Total Users
Google Analytics calculates the total number of unique individuals who visit your website within a specific period by tracking the user ID or cookies of each user. This metric gives you an overview of the size and reach of your site and helps you understand and monitor the growth of your user base as time goes on.
Active Users
This primary metric follows the number of people who visit your site and have an engaged session. An active user will be your most primed consumer, as they’re in a spot where they’re most likely to purchase a product or service from your company.
Pageviews
Pageviews are the total amount of times a specific page is seen on your website, and each page load logs as a pageview. It’s important to note that there may be several pageviews in a session, but five pageviews by the same person during the same period still equals one session.
Sessions Per User
Sessions per user is the average number of sessions per unique individual within a specified period. It’s calculated by dividing the number of sessions by the total number of users. With this data, you can understand how frequently users return to your website and is a strong indicator of customer loyalty and trust.
Engagement Rate
Totaling the percentage of engaged sessions on your website will equal the engagement rate. This number is calculated by dividing the number of engaged sessions by the sum of sessions and multiplying by 100.
Average Engagement Time
Your website’s average engagement time is the median amount of minutes a browser engages with your website. This number only takes active users or engaged sessions into account. In Universal Analytics, you could look at your average session duration or the most common time a user spent pursuing your site. Now, you can identify the time users are actively interacting with your site, which gives you further information about your audience.
Conversion Rate
The number of completed desirable actions by your visitors represents your website’s conversions. In GA4, you can specify specific measures or goals as conversion events, making this metric extremely flexible based on your company targets.
Where To Find Engagement Metrics in GA4
GA4 is ripe with information, and it’s easy to access once you’re familiar with the platform. If you’re just starting out with Google Analytics or are still getting your footing, here’s how you can find engagement metrics:
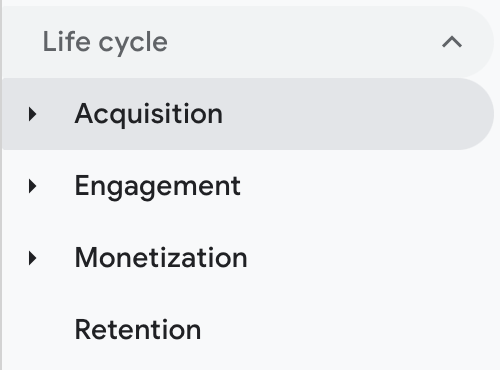
- Open GA4 and choose “Acquisition” from the “Reports section on the left-hand menu bar.
- Click “User acquisition.”
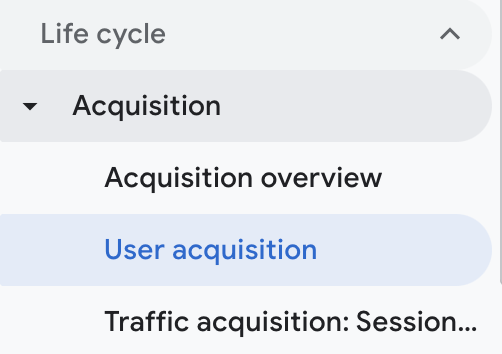
- From this screen, you can find your engagement overview, events, conversions and other engagement metrics all in one place.

If the overview of your insights in Google Analytics doesn’t include your website’s engagement rate, you’ll need to add them to your customizable report. To add it, follow these steps:
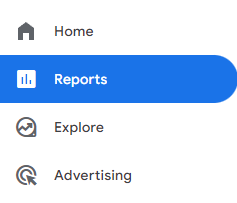
- After signing into your GA4 account, select “Reports” from the left menu.
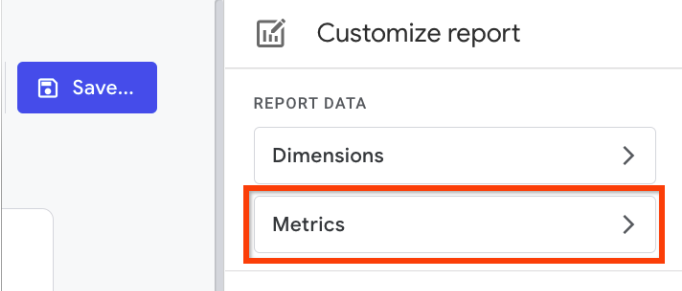
- Go to the report you want to change and click “Customize report” in the upper-right-hand corner.

- Click “Metrics.”
- Click “Add metric,” and type in the missing insight you’d like included.
- Click “Apply” and enjoy your updated reporting.
Ready To Evaluate User Engagement?
Whether you were less than thrilled about GA4 in the beginning or were ready to jump into the new platform from the get-go, there’s no denying that the technology is here to stay. As you seek out more engaged sessions with your digital marketing efforts, ensure you incorporate high-quality content, leverage audio-visual media and tailor messaging to your target audience’s preferences.
With top-notch content, increasing engagement can be a breeze, and GA4 will help you capture every necessary detail so you won’t miss a thing.